Media Supply Chain
undisclosed - August 2015
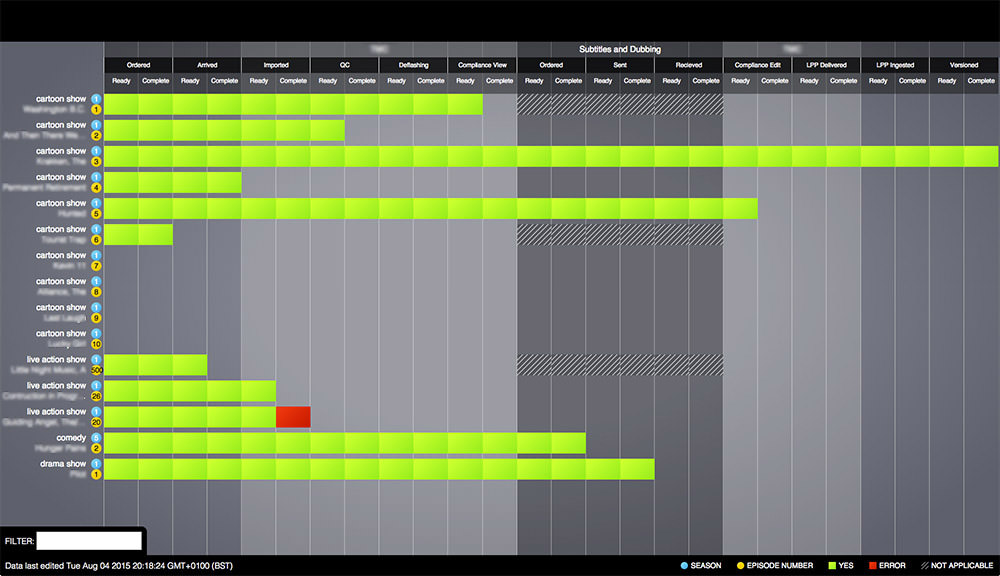
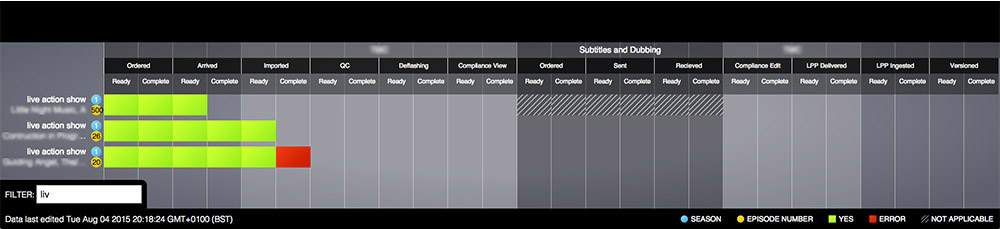
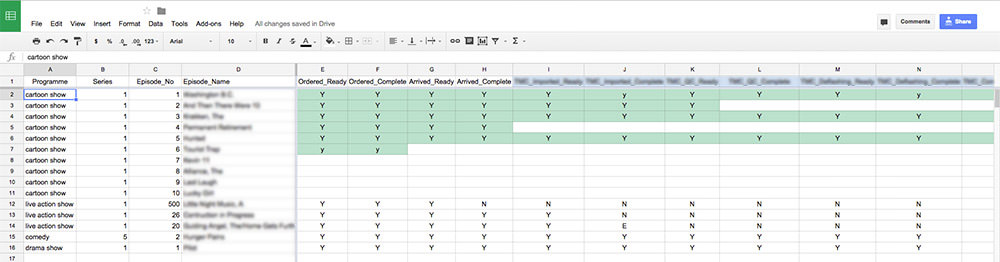
This was an interesting project. The client wanted a prototype of a visual system to see how far along the supply chain numerous projects (TV shows) were - within 3 days, and powered by a google spreadsheet that they store all of their data in. The data also had to auto refresh, and be easily filtered as the final product would have hundereds of rows.
I built this in Ember.js, and shimmed in the wonderful Tabletop.js to help with getting data from the google spreadsheet.
New data is requested every 30 seconds (can be set to any interval), and being an ember app with live data bindings, only the rows with changes are updated.
I used some simple handlebars helpers to lookup the value of cells, and colour code them - or produce an interactive button for error messages that pop-up the message when rolled over.
Binding a textbox value to a model filter in the controller allows the user to see results narrowed as they type.